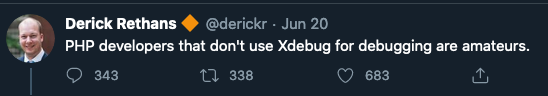
Quite the controversial “hot-take” from Derick, and while it certainly caused quite the stir (that it was probably designed to), it made me think. I thought, ‘Do I need to revisit Xdebug?’, and I realised that I’d fallen into Derick’s trap. But think I did.
Let’s clear up some existing thoughts I had on Xdebug – some readers might nod in agreement or have/had similar experiences:
- Like many PHP developers with significant experience: I know of Xdebug. It’s been around years – I started writing PHP professionally in 2016, by which time Xdebug had existed for 14 years. It’s not like it was some obscure or new tool being talked about.
- I’d tried Xdebug before at some point – I can’t recall when, and had an experience that left me thinking that understanding what you could do with it would take far too much time up for me to learn. Plus, things like custom “bookmark” browser extensions made it feel like you had to jump through a lot of hoops to use it effectively. A lot has changed since I started – I use Jetbrains PHPStorm as my IDE, and develop with Docker. It was a pain trying to set it up manually before, but what about now, where Xdebug runs a server on an IP, but it will be running in Docker?
- I’ve previously written an article (https://devtheatre.net/psysh) on how superb PsySh is as an application’s command line.. Given that when used as part of Laravel’s tinker it boots up the whole app into a REPL environment, does that render something like Xdebug somewhat redundant?
- Lastly, but most importantly for developers: why bother when you can use var_dump() or Symfony’s dump() or Laravel’s dd()?
These thoughts of mine were also circulated in others’ replies to the tweet, but it was when Tighten’s Matt Stauffer and Twilio’s Gary Hockin stepped in to offer livestreams with Derick to set it up that I took notice – the resulting content is now excellently documented at https://learnxdebug.com with others’ contributions.
So, I thought: why not give it a go again? And so I did, going step by step though Gary and Derick’s video, with the goal to implement it into our development process for our Open Source project Awe-der.
How hard can it be?
One of the things that most articles I’d read or tried to follow miss out one core thing that frustrated me: most have the “how”, but not the “why”. That is to say: what is this thing I’m doing and why does it work? Bearing that in mind, here is how I implemented the stack, step by step with a little bit more info than just your average set of instructions.
The Stack
-
MacOS 10.15 (Catalina)
-

PHPStorm 2020.1
-

PHP 7.4.4 (from official PHP Dockerfile)
-

Docker 19.03.8 (engine) 1.25.5 (compose)
Step One: Installing Xdebug
Part of what made the installation significantly easier for me was that the project it was being installed on was already using a Dockerfile as part of the stack. So, to install Xdebug, you need to include it with pecl (you can still -only- use pecl for operating system-level dependencies at the time of writing). Our project had this in our Dockerfile to install redis and imagick:
RUN docker-php-source extract && \
   pecl install redis && \
   pecl install imagick && \
   docker-php-ext-enable imagick && \
   docker-php-ext-enable redis && \
   docker-php-source delete
It’s at this point you want to install it with pecl, so add pecl install Xdebug into the run commands for the container:
RUN docker-php-source extract && \
   pecl install redis && \
   pecl install xdebug && \
   pecl install imagick && \
   docker-php-ext-enable imagick && \
   docker-php-ext-enable redis && \
   docker-php-source delete
Step Two: Configuring Xdebug
Before Docker, Xdebug was relatively straightforward to configure on a platform, in that it was a new set of the php.ini parameters – you’d either just edit the existing php.ini, or load in a custom ini or override. Now we’re running PHP and fpm in a container, so we need to inject the configuration in with docker-compose.
First, create the file to inject and save it in the project root – let’s call it xdebug-local.ini.
Here’s what to put in it:
zend_extension=xdebug
xdebug.remote_enable=1
xdebug.remote_autostart=1
xdebug.remote_port=9001
xdebug.remote_host=host.docker.internal
I said this wouldn’t just be a copy and paste article, so: what are these parameters?
Zend_extension has always been the PHP ini file parameter name for adding in extensions – it hooks the pecl extension (or extensions installed with other tools like PEAR) installed to the runtime, so things like zip, redis, curl and the like use the same parameter to enable them.
xdebug.remote_enable and xdebug.autostart are more interesting. Remember me mentioning “bookmarklets” in the browser earlier? You have to use an extension to keep a server connection alive with your Xdebug session – for example, for Firefox:
https://addons.mozilla.org/en-US/firefox/addon/xdebug-helper-for-firefox/
Sound clunky? You bet. Is it required? Absolutely not. Enable remote triggering of the Xdebug server and set autostart to true when either a breakpoint is hit in the code or you’ve set the break to be at the entry point to your application’s code and: bingo. It triggers your debugging session. Do I wish I’d have known about this years ago? For sure.
Xdebug.remote_port has an interesting quirk in that if you don’t set the parameter, it defaults to port 9000. I guess it’s an interesting aspect that shows Xdebug’s history in that it was probably chosen as a default port before the CGI adopted replacement php-fpm used port 9000. So, it’s important to set the remote port to 9001 (or whichever free port you wish) to stop clashes.
Xdebug.remote_host is the point at which our Docker configuration starts making the process perhaps a little convoluted. In our case, we develop as a company with Macs, so it’s handy that Docker has a reserved handle (host.docker.internal) to route into the correct IP. Windows does the same at the time of writing, but Linux distributions might need a bit of research to get the correct address in here to connect into Docker.
Step Three: Inject Config to Docker
So, using docker-compose, we now inject the local ini file into the php container’s conf.d directory. The docker-compose file should look something like this:
php:
   container_name: my_container
   build: ./path/to/my/php/dockerfile
   environment:
       PHP_MEMORY_LIMIT: '128M'
       DB_HOST: 'mysql'
       DB_USER: 'root'
       DB_PASSWORD: 'root'
       DB_NAME: 'if_your_app_has_a_db'
       PHP_IDE_CONFIG: 'serverName=myapp.url'
   volumes:
       - ./:/var/www/vhost/:cached
       - ./xdebug-local.ini:/usr/local/etc/php/conf.d/xdebug-local.ini
There are two things here to point out. Firstly, the docker volumes – it’s this line that’s going to enable Xdebug:
./xdebug-local.ini:/usr/local/etc/php/conf.d/xdebug-local.iniThe second one was a big gotcha: PHPStorm will need to match the incoming Xdebug server request to the webserver that’s set up in the IDE.
PHP_IDE_CONFIG: 'serverName=myapp.url'I hadn’t actually set up the webserver on PHPStorm because I personally find a lot of the CLI and server setups for it extremely complex and hard to understand. But, because this environment variable is used to match to PHPStorm’s webserver setup, it cannot match the file structure without it – but more on that in a bit.
It’s time to check that Xdebug is working: rebuild your Docker stack
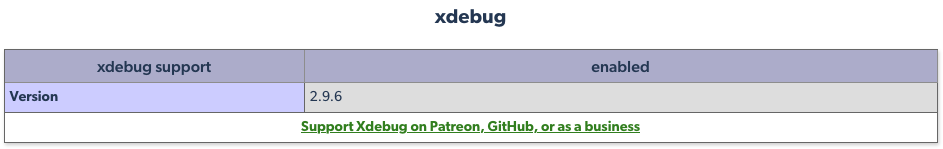
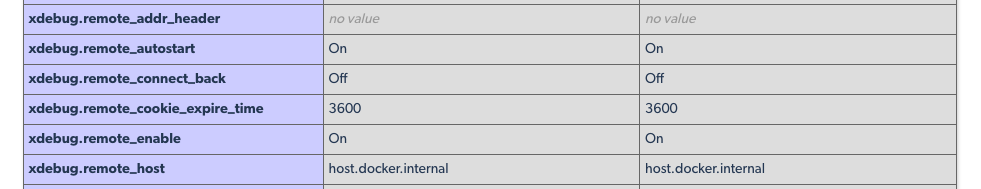
docker-compose build build && docker-compose up -dAnd to check, debug by throwing phpinfo(); into an entrypoint to your app. Navigate to Xdebug on the page and you should see the following:
Step Four: Set up PHPStorm
I briefly mentioned that you need to set up your web server on PHPStorm first – so do that first. You can find pretty comprehensive and complete docs from Jetbrains on this here: https://www.jetbrains.com/help/phpstorm/creating-local-server-configuration.html#example1
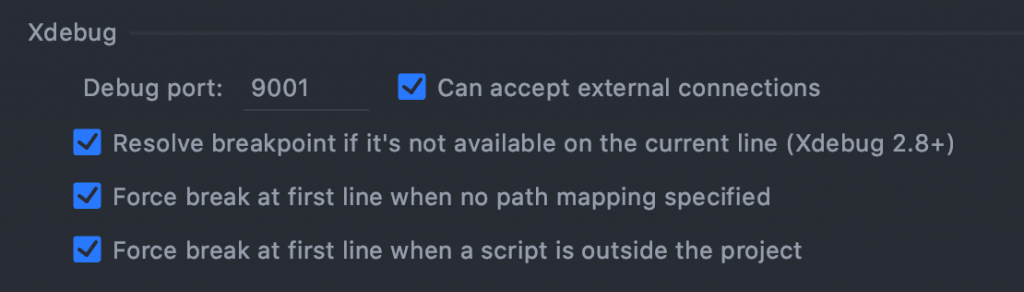
Now we get PHPStorm to listen to port 9001 which we set in the config. You can change that like so:
Path mapping is important – PHPStorm has no way from the incoming request of knowing how the application is structured. Here’s an example of the configuration for Awe-der:
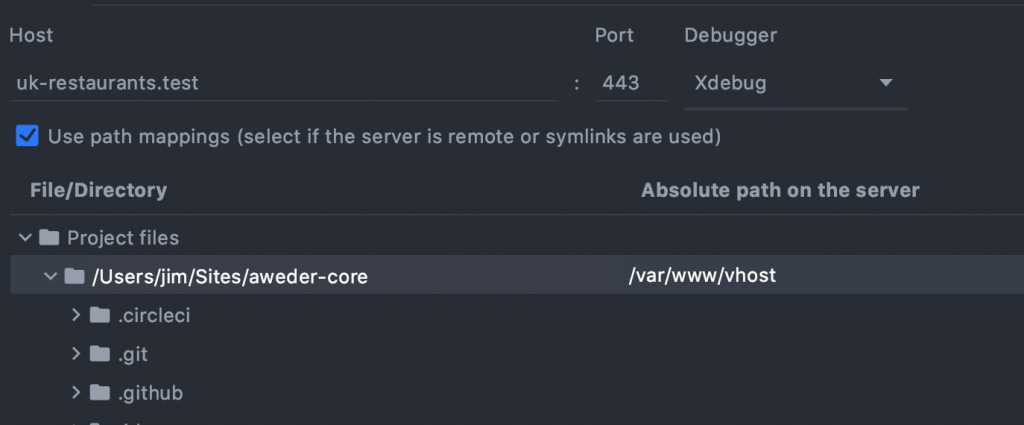
The absolute path on the server is what you need to change – make sure you change it to the root path served by your Docker stack (in our case, where nginx is serving the root of the application). This is an important step because PHPStorm assumes that the root directory from the incoming request is the public folder (if using either Symfony or Laravel). Make sure you also choose Xdebug as the debugger and use the appropriate HTTP port. Now, set PHPStorm to listen:
It’s time for the moment of truth: you’re listening for connections, you’re mapped, you’ve setup the Xdebug server: showtime. Add a breakpoint in PHPStorm (preferablly at the entry point of your app, so you know it’ll get hit), fire a request in the browser and IF everything is OK you’ll get an incoming connection from Xdebug in the IDE. Happy days if you did, don’t despair if you don’t: there are a lot of gotchas here. If nothing happens, the other tutorials at https://learnxdebug.com/ will probably have the answer.
As promised: Turbocharged Development
So, here’s what you actually came here for, right? As with debugging in other interpreted languages, your start point will be a breakpoint (you can actually set PHPStorm to hit a breakpoint whenever a new file entry point is detected as well).
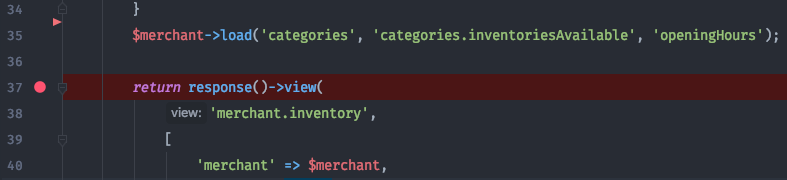
Here’s a breakpoint set in our Awe-der project. We’re listening for connections – so, all being well we hit the Controller when loading the page, and hey presto! PHPStorm’s debugging pane appears.
Now that we’re at a paused moment in the runtime, let’s check out what we can do.
Console / Evaluate expression
You get a console that can run executable PHP within the runtime you’re in. That is… absolutely magic. Here’s an example of using the console live within Xdebug that will save you a mountain of var_dump() calls:
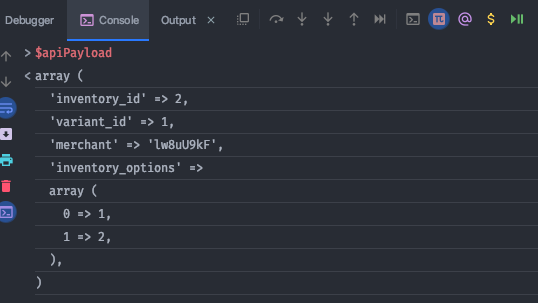
Putting a variable straight into the console will print it, in exactly the same way that Javascript does it with console.log in a browser console.
We can change something on any variable at runtime in the console. Take for instance this line:
$orderItem->fill($apiPayload);That’s Laravel’s Eloquent ORM. Why not see what happens at runtime when you do something else with it in the console?
$orderItem->toArray()
array (
'order_id' => 1,
'inventory_id' => 2,
'variant_id' => 1,
)
$orderItem->fill([‘order_id’ => 234523523]);
$orderItem->toArray()
array (
'order_id' => 3333,
'inventory_id' => 2,
'variant_id' => 1,
)
Done. We’ve just messed around with an entity on the fly.
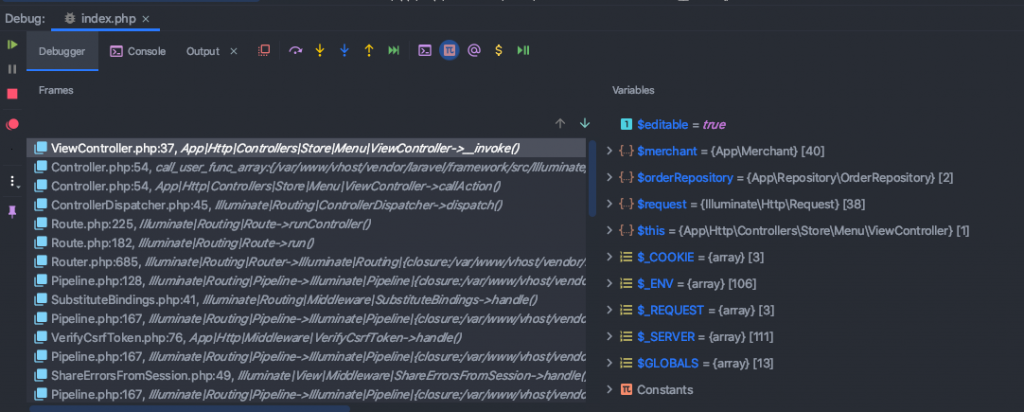
The console has everything set & booted (assuming you’re using Composer’s autoload) to the point it’s activated – so crucially local scope variables are available. You can also navigate the stack as well via. the frames in the debugger. Laravel has pretty detailed stack traces when you use Blade, but they’re not interactive ones like we can get in the IDE:
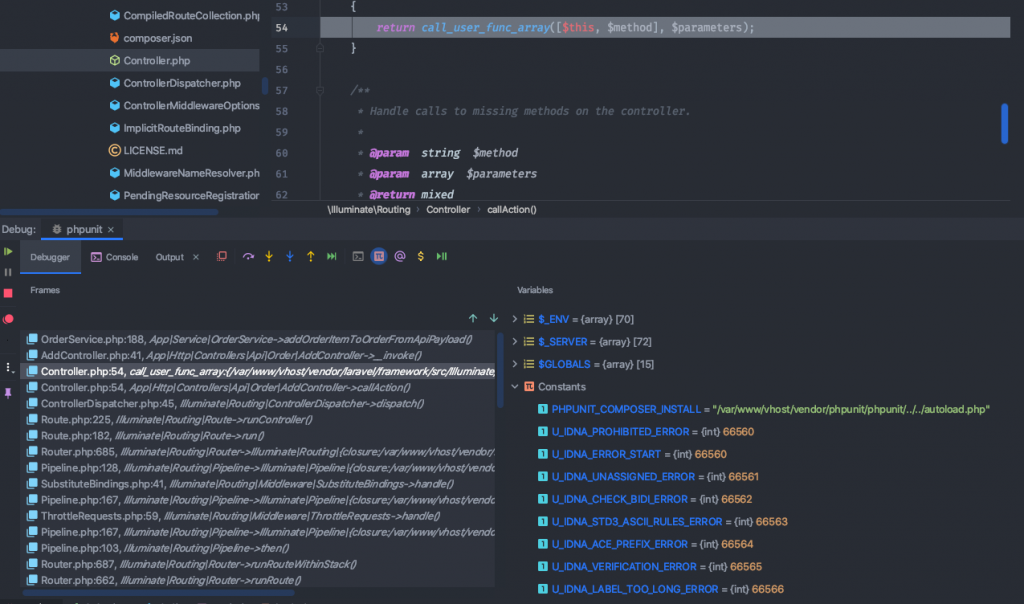
This is next level debugging. You can navigate the frame pane to the left to view the executed stack. When you select a frame from it, the editor pane will navigate to the function call in the code and the variable pane will update to everything that has been set at that point. For big monolith stacks full of services and function calls all over the place, you’ve now got far more visibility. Pretty neat, huh?
Conditional Breakpoints
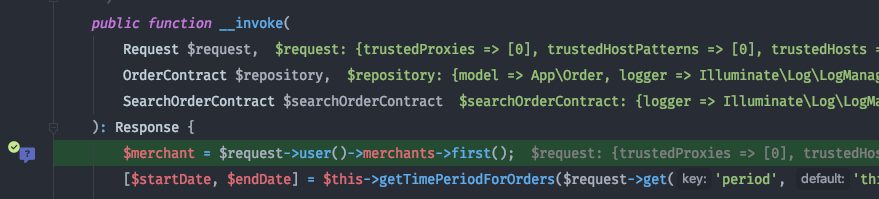
An underrated feature is the ability to set breakpoints conditionally. For an example, let’s say that we only want to trigger the breakpoint to debug if an incoming request to a controller has a “search” term set.
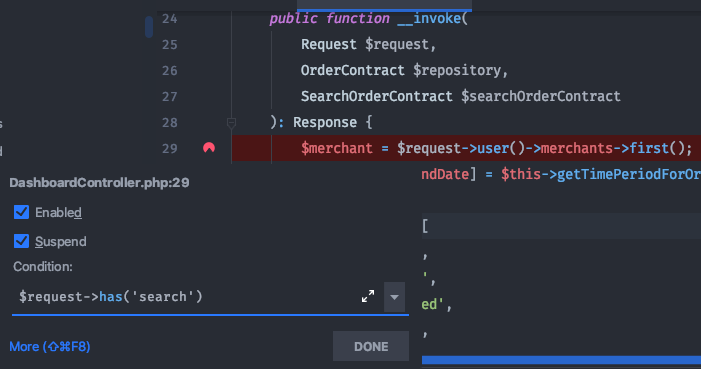
Done. Another joy of this in PHPStorm is that the Condition window behaves like any other console window, so you get application-wide autocompletion and local variable autocompletion.
So, if we hit the URL:
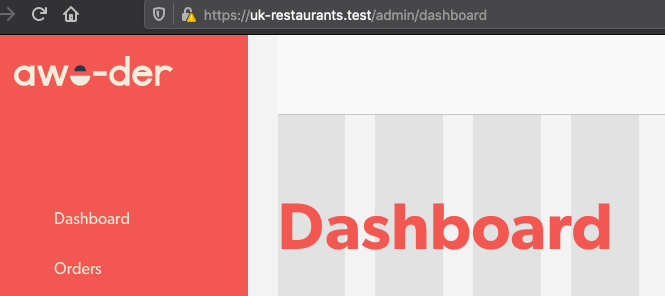
Loads as expected, but add the search term in to the URL:
Watchers
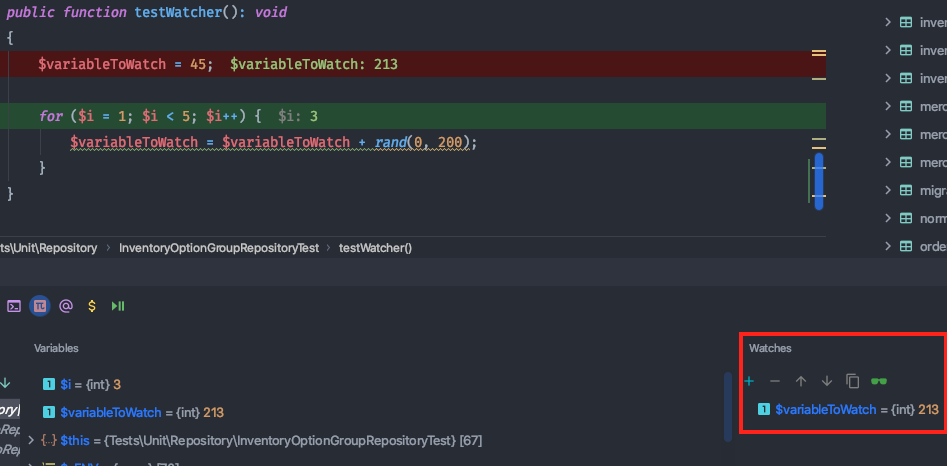
Common debugging nightmares include mutable objects being hit -somewhere- in the stack. We have visibility of the stack, but that’s not much help when tracking a specific object. To set a watcher, add an expression in the watcher pane to the left. It will be evaluated with each step you trigger. A good example to see it in action would be the classic C loop:
public function testWatcher(): void
{
   $variableToWatch = 45;

   for ($i = 1; $i < 5; $i++) {
       $variableToWatch = $variableToWatch + rand(0, 200);
   }
}
Set a watcher on $variableToWatch, and check out the watcher doing it’s magic just like any Javascript browser watcher as you step over the code:
Step & Cursor controls:
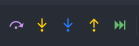
The five controls are as follows:
Step over: run to the next line of code
Step into: run into the next line, moving the cursor if entering a method call
Force step into: same as Step into, but runs with calls into vendor/3rd party code for deeper debugging
Step out: complete the current method and stop at the next line after the method that called it
Run to cursor: For me, this is the most important one, and I’ll tell you why:
If you’re debugging something quite straightforward in that it’s your own code entirely, or something like the Slim framework with as little code as possible, stepping through the code is pretty logical. However, for those using a big framework – Laravel, Symfony, Cake, WordPress etc. there are calls, pipelines and event handlers all over the app. That magic has got to happen somehow, and if you try and step into it, you can see it in action.
Don’t want to see all the handlers resolve? Cool. Move the cursor to the next line you want, so you can see the result piped into the variable frame. Hit run to cursor, job done.
Probably the most important: modifying the output
Modifying the output is, in my opinion, what makes Xdebug so powerful. We’ve looked at the fact that you can change variables and interact with the code at runtime, but what hasn’t been mentioned is that if you instruct the debugger to complete, the output is the changed output. To see it in action, here are two use cases:
Blade templates
We have a variable named $dashboardMetrics that’s passed into our template for rendering. Here it is rendered:
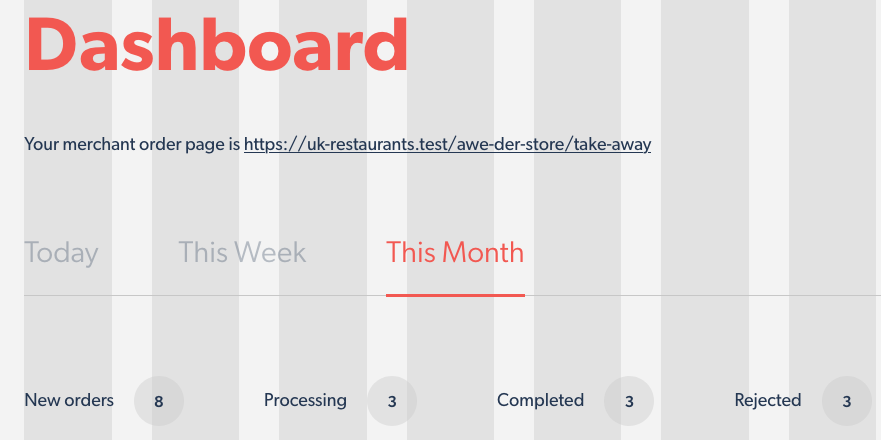
And, with a breakpoint set in the debugger, here is the payload printed out at the point it’s about to be loaded into the template:
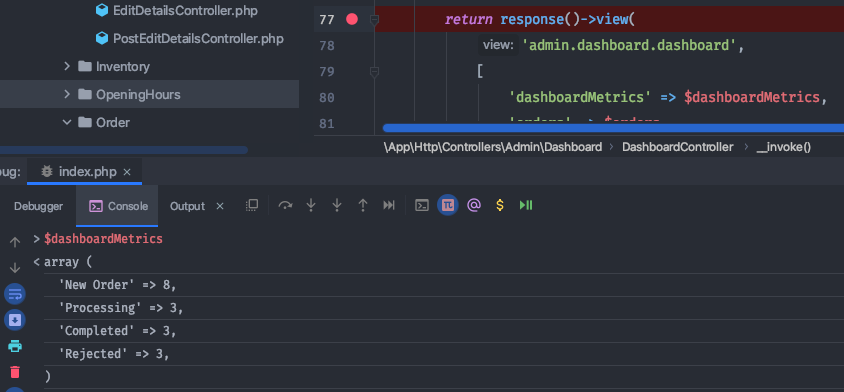
So, I’m going to change “Processing” to 999. Hitting the breakpoint again, I’ll use the console to set it:
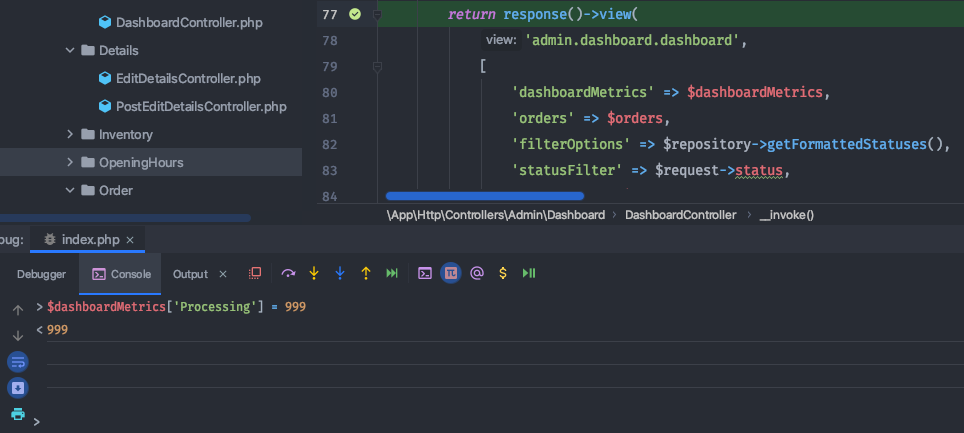
On the left hand side of the debugger pane you have the a “Resume Program” button. It allows you to complete the incoming request, so hit that and:
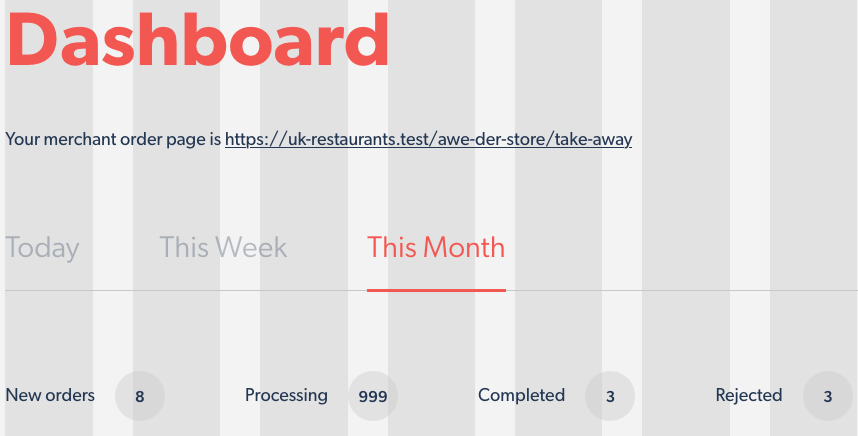
Request completed, you’ve modified runtime to change it.
API calls
Exactly the same logic applies to changing the output of an API request. Here I’m using Postman to get an entity via. A UUID:
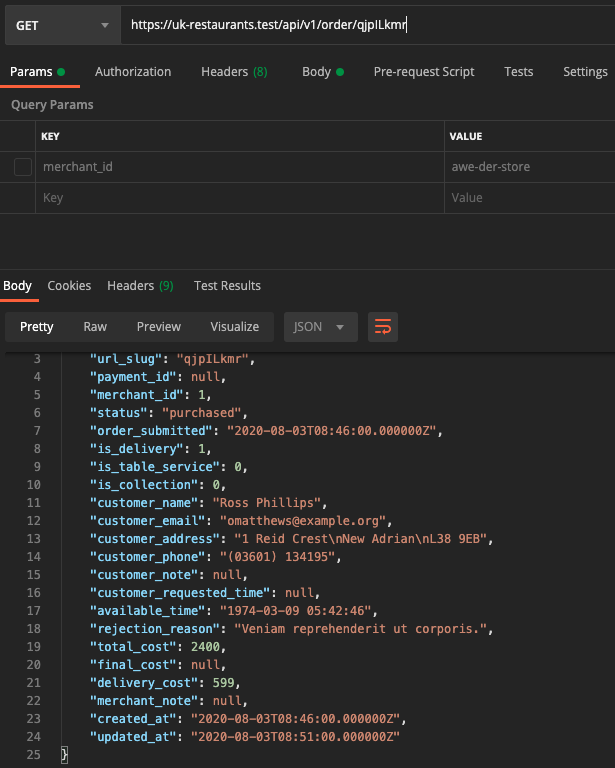
Using the same method as the browser request, we’ll put a breakpoint into the API method and modify the output. Here’s the method response:
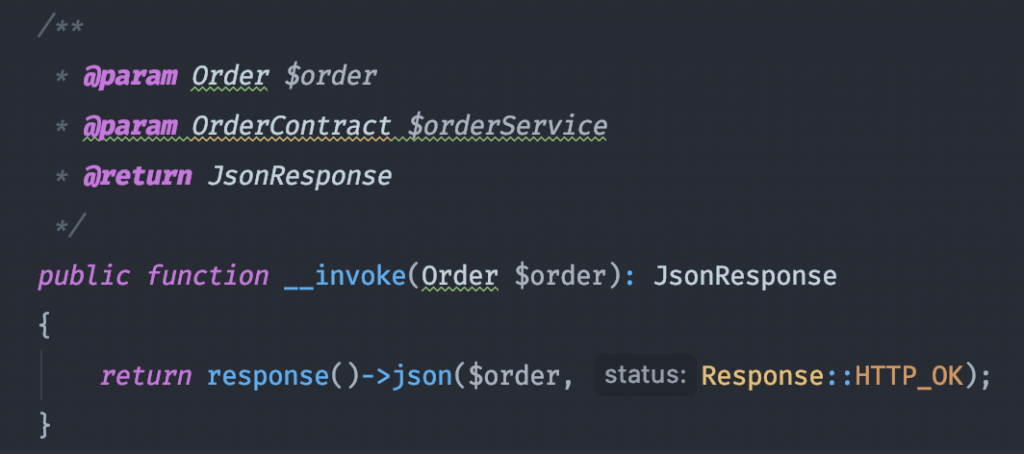
(Protip for Laravel – don’t do this, always use Laravel Resources!)
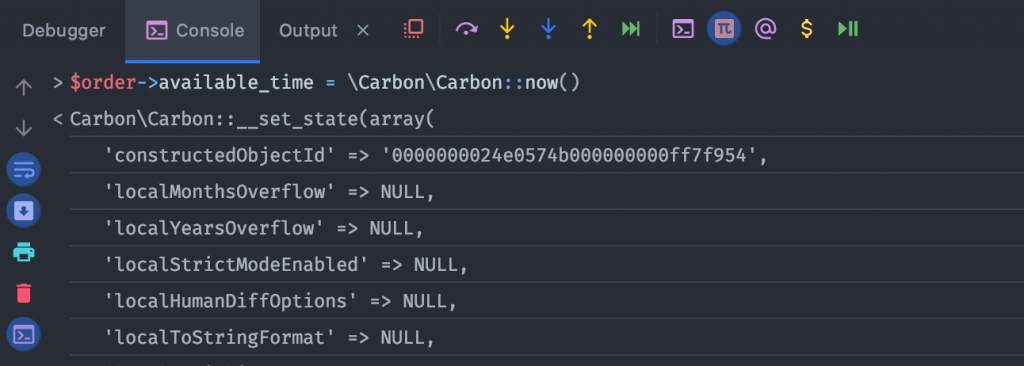
So, at the breakpoint let’s change the entity making the available_time now instead of the dummy date using the Carbon library:
Resume runtime, and check out the result from Postman:
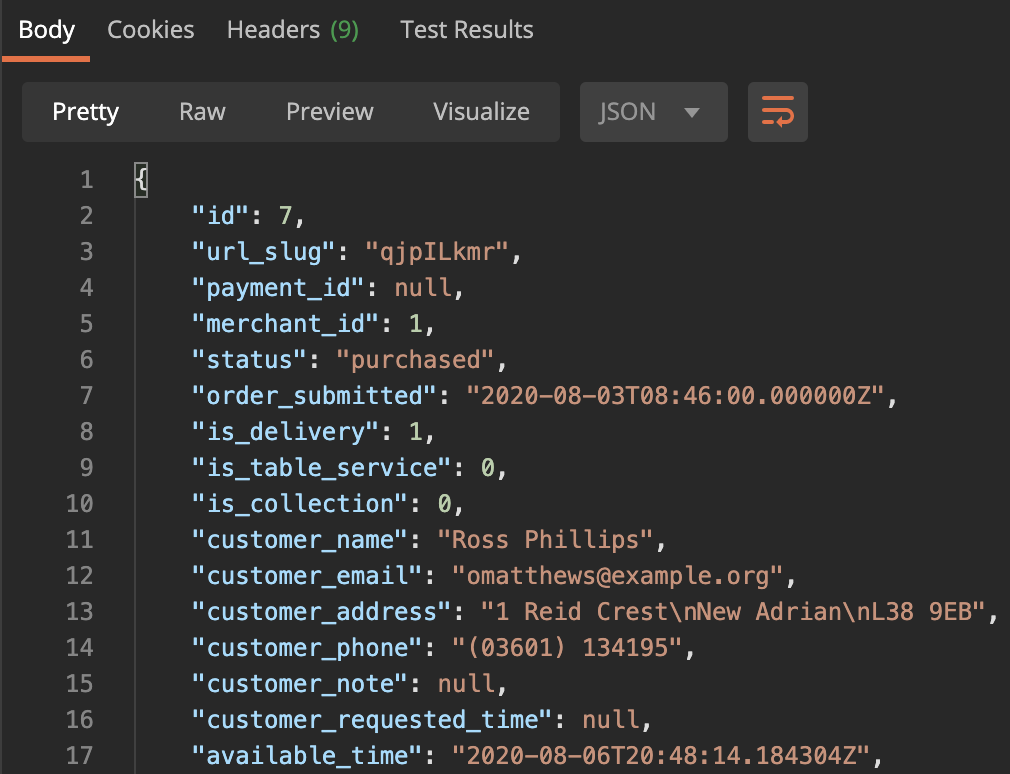
Magic.
I came into this with some thoughts and assumptions, so I’ll tie up my new experience with Xdebug in some key points that answer those questions.
Conclusions
Q: Why use Xdebug when you can var_dump() ?
A: Because it allows you to manipulate the runtime. If you use something like var_dump() you need to fire the CLI constantly or hit refresh on a browser over and over to get to the same point. Instead, you now have the chance to dynamically change and modify the stack – which is a big timesaver.
Q: You mentioned PsySh, why not use that?
A: Xdebug and PsySh are very different beasts. Whilst PsySh is labelled somewhat of a debugger, I don’t really treat it as such. It’s vital as a booted command line for your app, similar to manage.py for Django, but it’s not a pure debugger like Xdebug is.
Q: This is still hard to set up still, isn’t it?
A: I’d say it’s probably less of a mystery now that I’ve looked at it, and not as hard as most developers think. Plus the toolset for everyday use is so powerful, it’ll save you or your team a big chunk of valuable time and cognitive load.
Q: Are there downsides to using Xdebug?
A: The biggest downside I found was execution time. With the configuration in this article, the Xdebug server is always on – for a full PHPUnit test suite to run (if it’s pretty comprehensive) it will take a -big- performance hit. Luckily, there are workarounds for this in Docker, such as running commands with a custom ini to switch the Xdebug server off. If you’re in Production this is a real no-no.
Overall, I’d say the tradeoff for time was well worth the effort. Something like this should be part of a developers’ tool chain – sure, it’s not always needed. If you’re doing an MVP in Laravel that’s mainly just CRUD operations, there’s probably not much justification for it.
However, I’ve found that for many modern practises – comprehensive unit tests with large coverage from TDD, interface-based development and well-separated call stacks from considered single-responsibility principle controllers really do mean Xdebug gives you a decent edge.
If you’re working on a legacy application in Zend Framework 2 or 10,000 line controllers in someone’s 2006 bespoke framework and you’re not using Xdebug, I’d come to the conclusion that you love the punishment, and like it that way, you massochist.
Q: What’s the outcome of trying it out?
A: Development with TDD and Xdebug felt incredibly empowering, so we’re going to look to make it part of the default development environment & process.
Q: How much does Xdebug cost?
A: It’s free. Although, it depends on what the definition of “free” is – as it’s Derick’s Open Source project, it costs vast amounts of personal development time. If you want to try it out from reading this article (or you want to try it out with a different platform – check https://learnxdebug.com for other tutorials) then considering supporting his work:
https://xdebug.org/support
Happy debugging!